








STOCKS TO WATCH NEXT WEEK
26 Sept 2026, 9:25 am
Hidden Setup? Siemens Energy Is a Stock to Watch Next Week
Siemens Energy is on our stocks to watch next week list as price approaches an important support area.
The interesting part is that the setup cannot be judged by price alone.
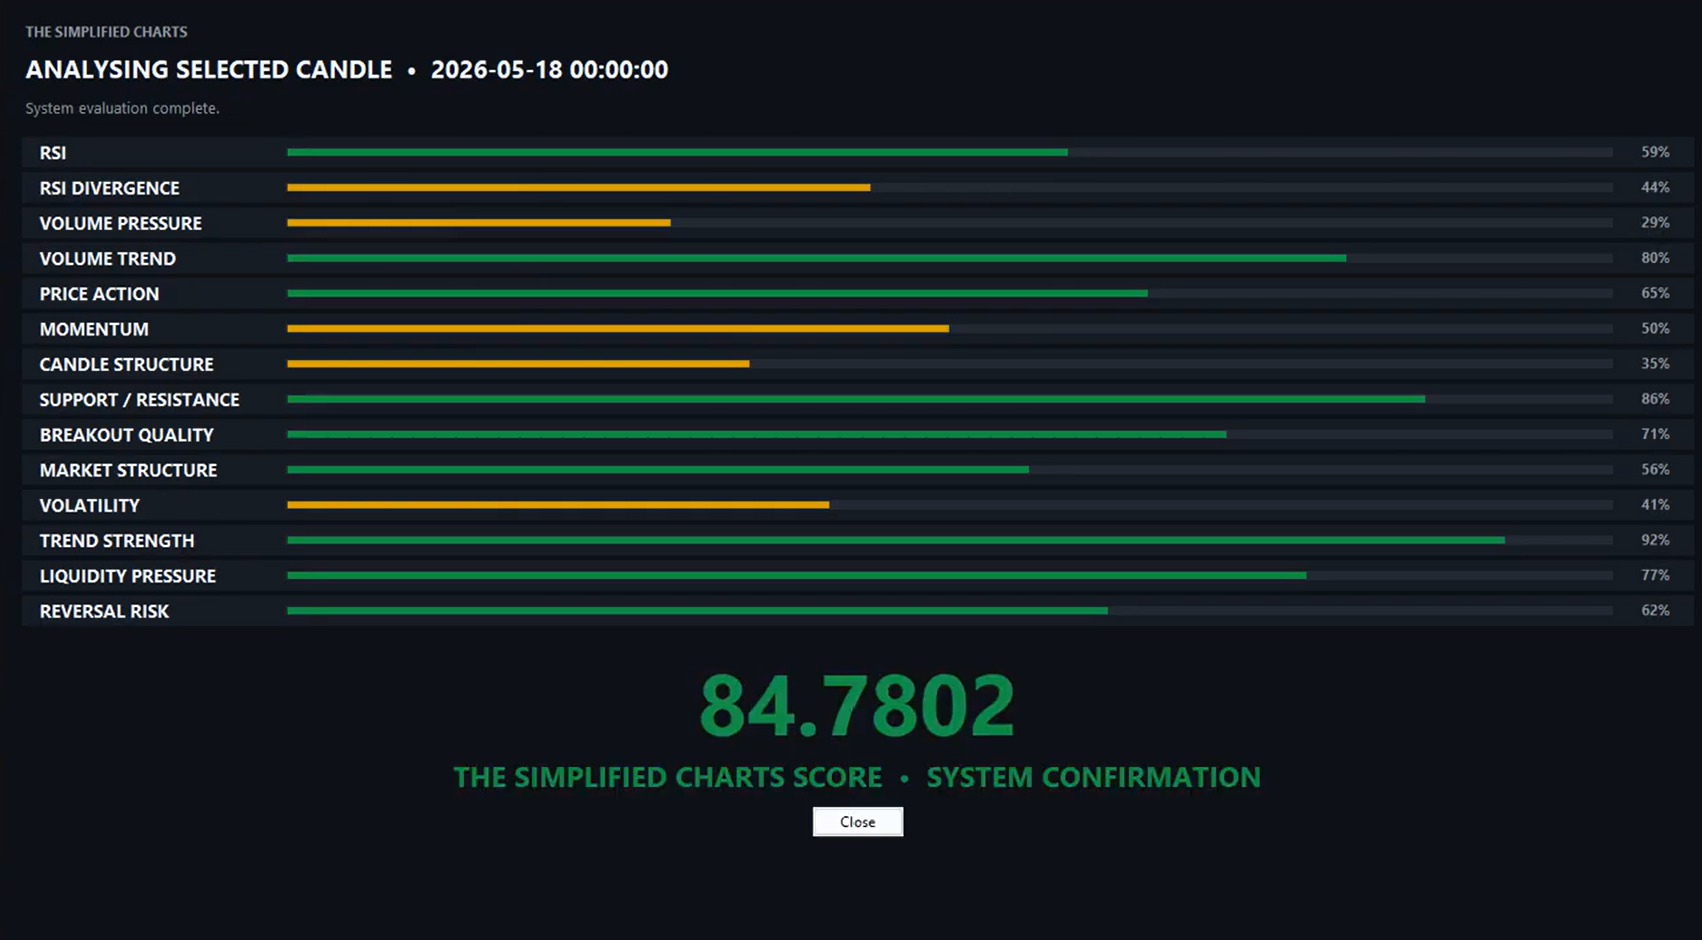
The 18 May weekly candle showed a stronger breakout structure, with accumulation appearing after liquidation, visible smart-money footprints, and a participation score of around 84.78. That combination helped identify the support zone now being watched.
The 10 August post-results move tells a different story. Price reacted strongly to the results, but the supporting participation was much weaker, with no clear smart-money footprints and only modest volume expansion.
Now price has returned toward the previously identified support zone.
For next week, the focus is on three things:
Support reaction: Does price hold the zone and produce a meaningful bounce?
Participation: Does volume and smart-money activity improve with the move?
Structure: Does the existing base remain intact, or does price move into a new area requiring fresh evaluation?
The current three-zone framework is:
Hold Zone - the existing base remains intact.
Caution Zone - the base is broken and the setup needs fresh evaluation.
Structural Breakdown Zone - the previous structure is decisively lost.
Note: This content is for educational and informational purposes only. It is not investment advice or a recommendation to buy, sell, or hold any security. Always conduct your own research and manage risk independently.
Join the discussion